.jpg)
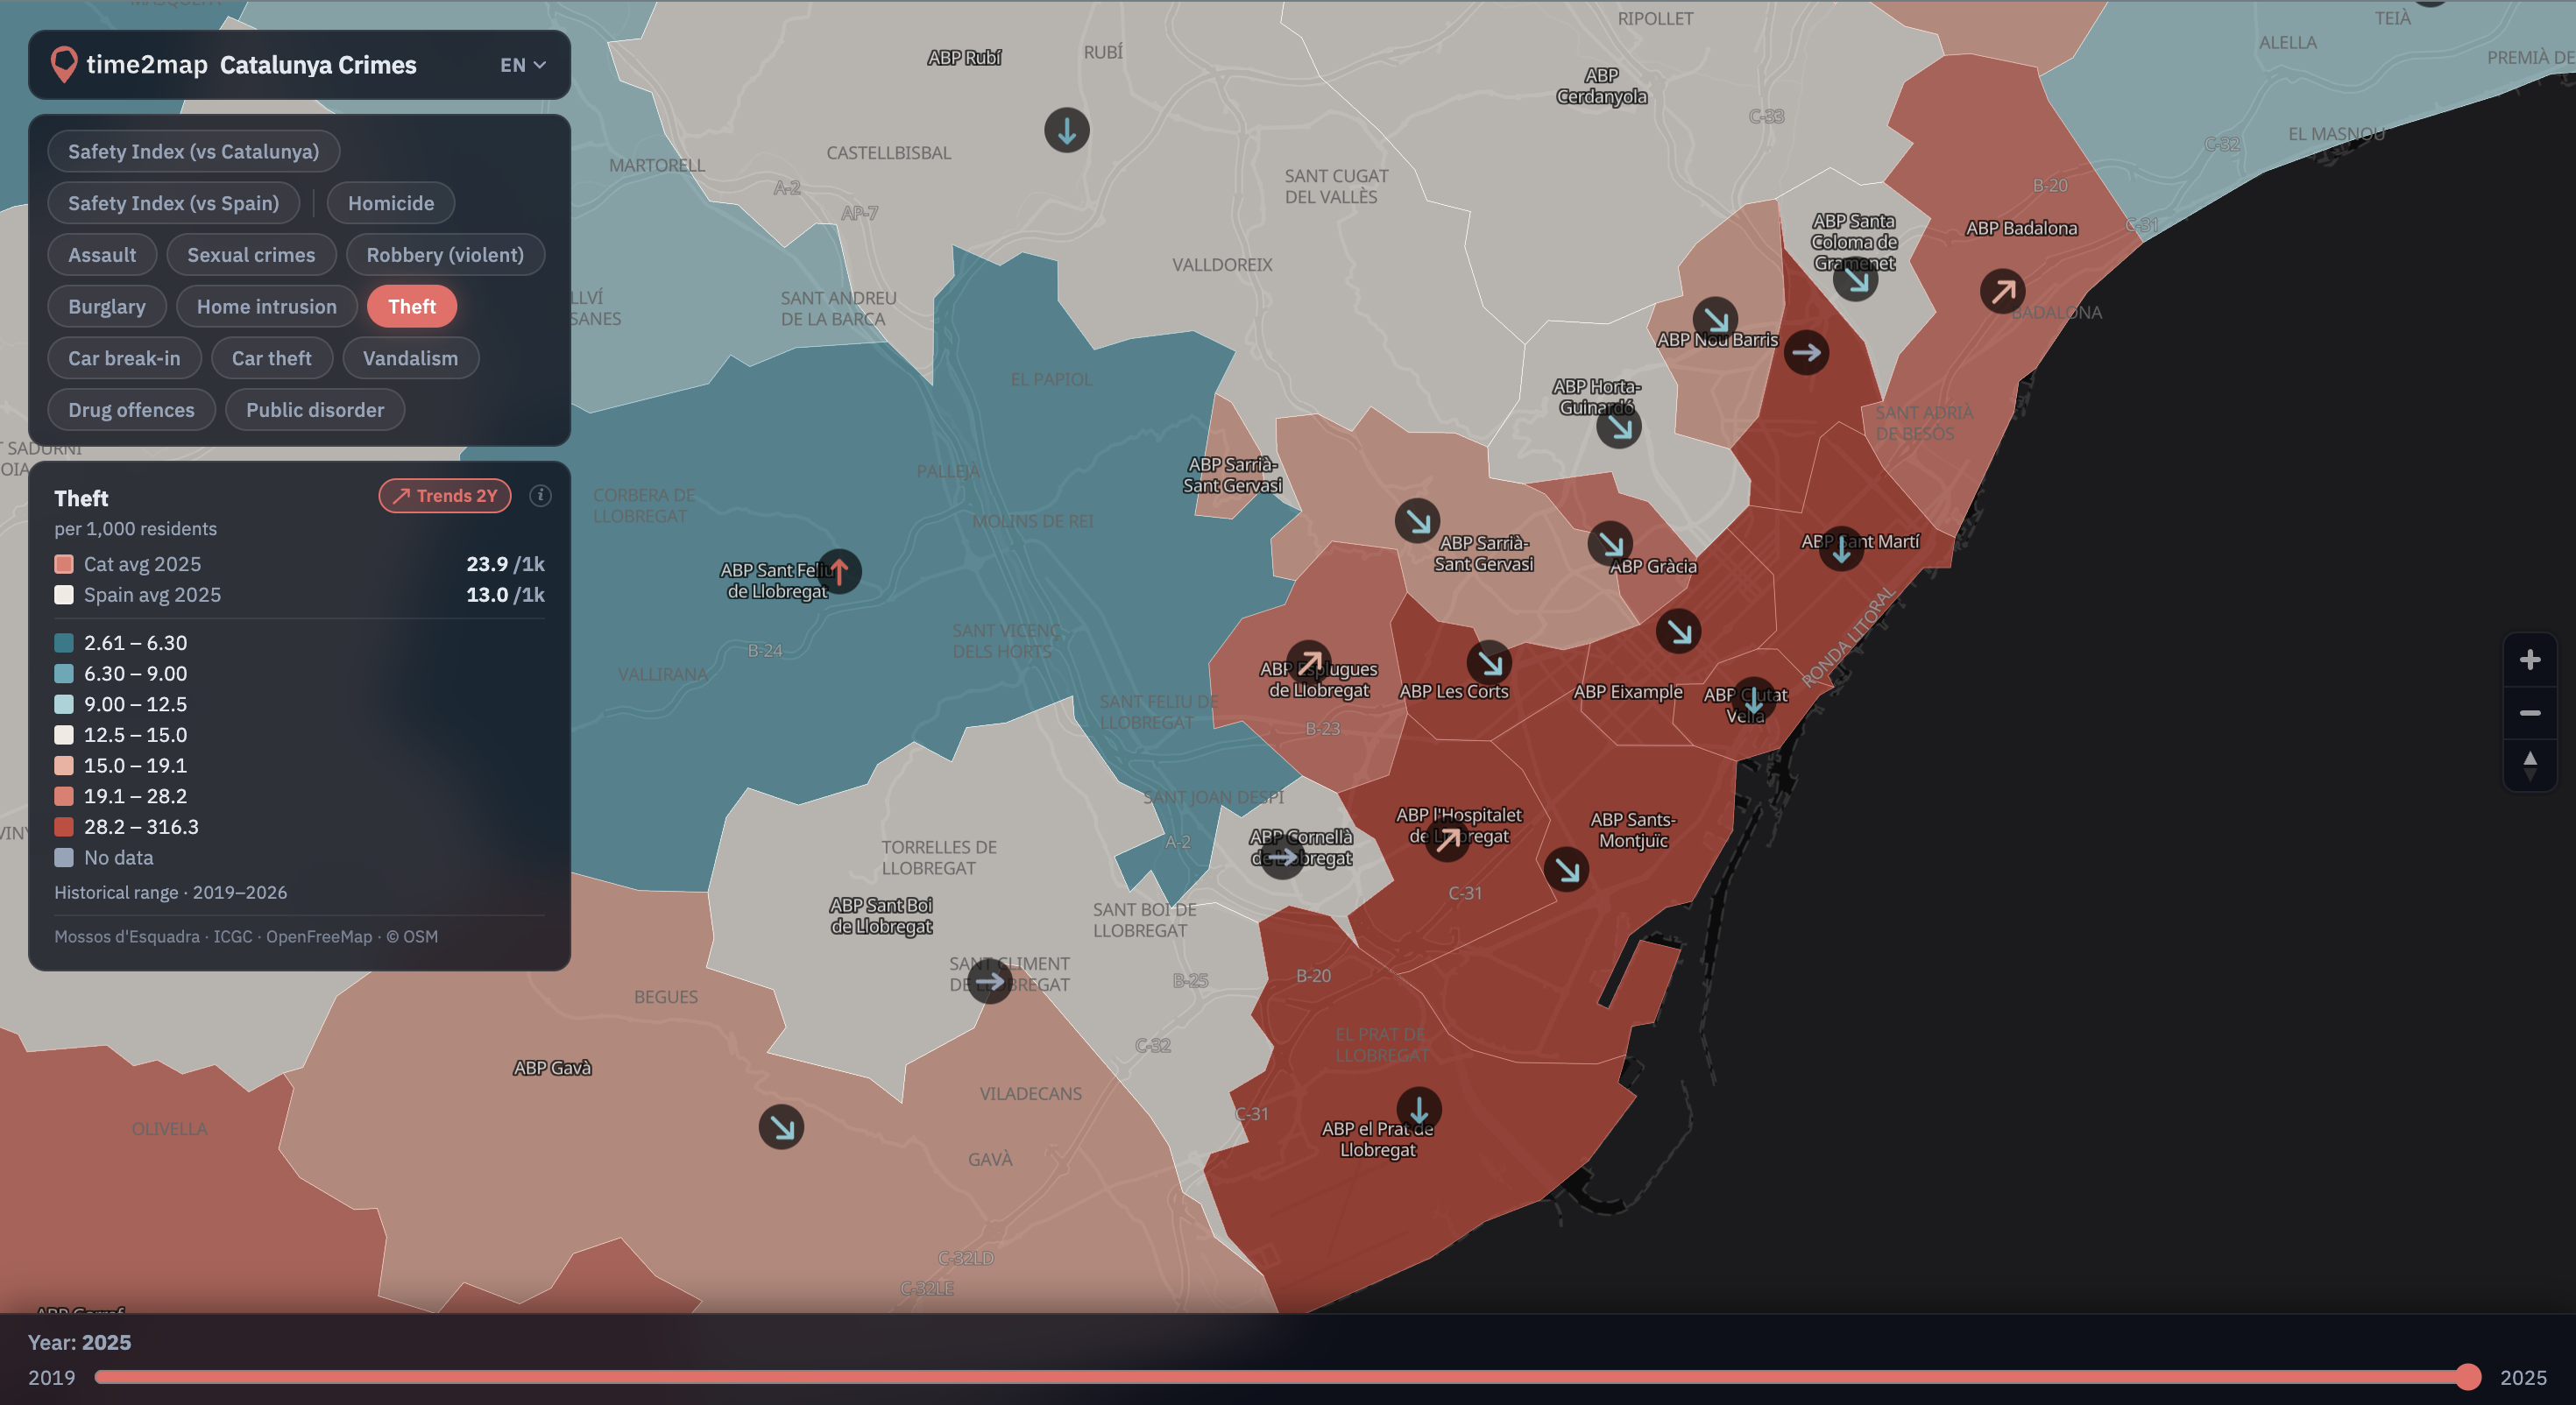
Crime statistics in Catalunya are publicly available — but understanding them takes patience. I built this map to make sense of the data: a composite safety index across 12 crime types, mapped by police zone, with trends since 2019 and a comparison against Spain's national average.


The Mossos d'Esquadra publish detailed crime statistics through the ICGC crime map viewer — a solid resource covering all 59 ABP police zones across Catalunya, with yearly data going back to 2019. There you can filter by crime type, see charts per zone, and compare against the Catalan average. It's a useful starting point, and I used it constantly while building this.
After spending time with it, though, I kept running into the same gaps. There's no composite safety score — you have to click through each crime type one by one, which makes it hard to get an overall feel for a zone. There's no comparison with Spain, only with Catalunya — which matters if you're an expat trying to calibrate what "above average" actually means in practice. And spatial trends are invisible: you can pull a chart for a single zone, but not a regional view of which areas are getting better or worse over time.
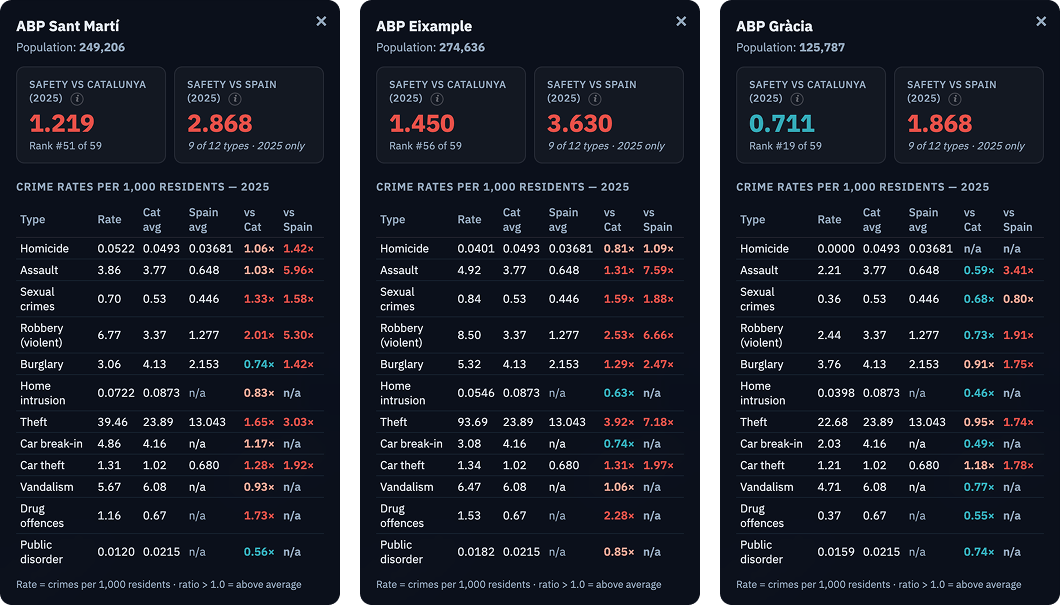
For an average Spanish relocating to Barcelona, crime rates feel dramatically higher than back home. Across the zones shown — Sant Martí (×2.9), Eixample (×3.6), Gràcia (×1.9) — the pattern is consistent. Catalunya's average is already elevated compared to most Spanish regions, and Barcelona pulls it further. The Barcelona safety index vs. Spain is not close.
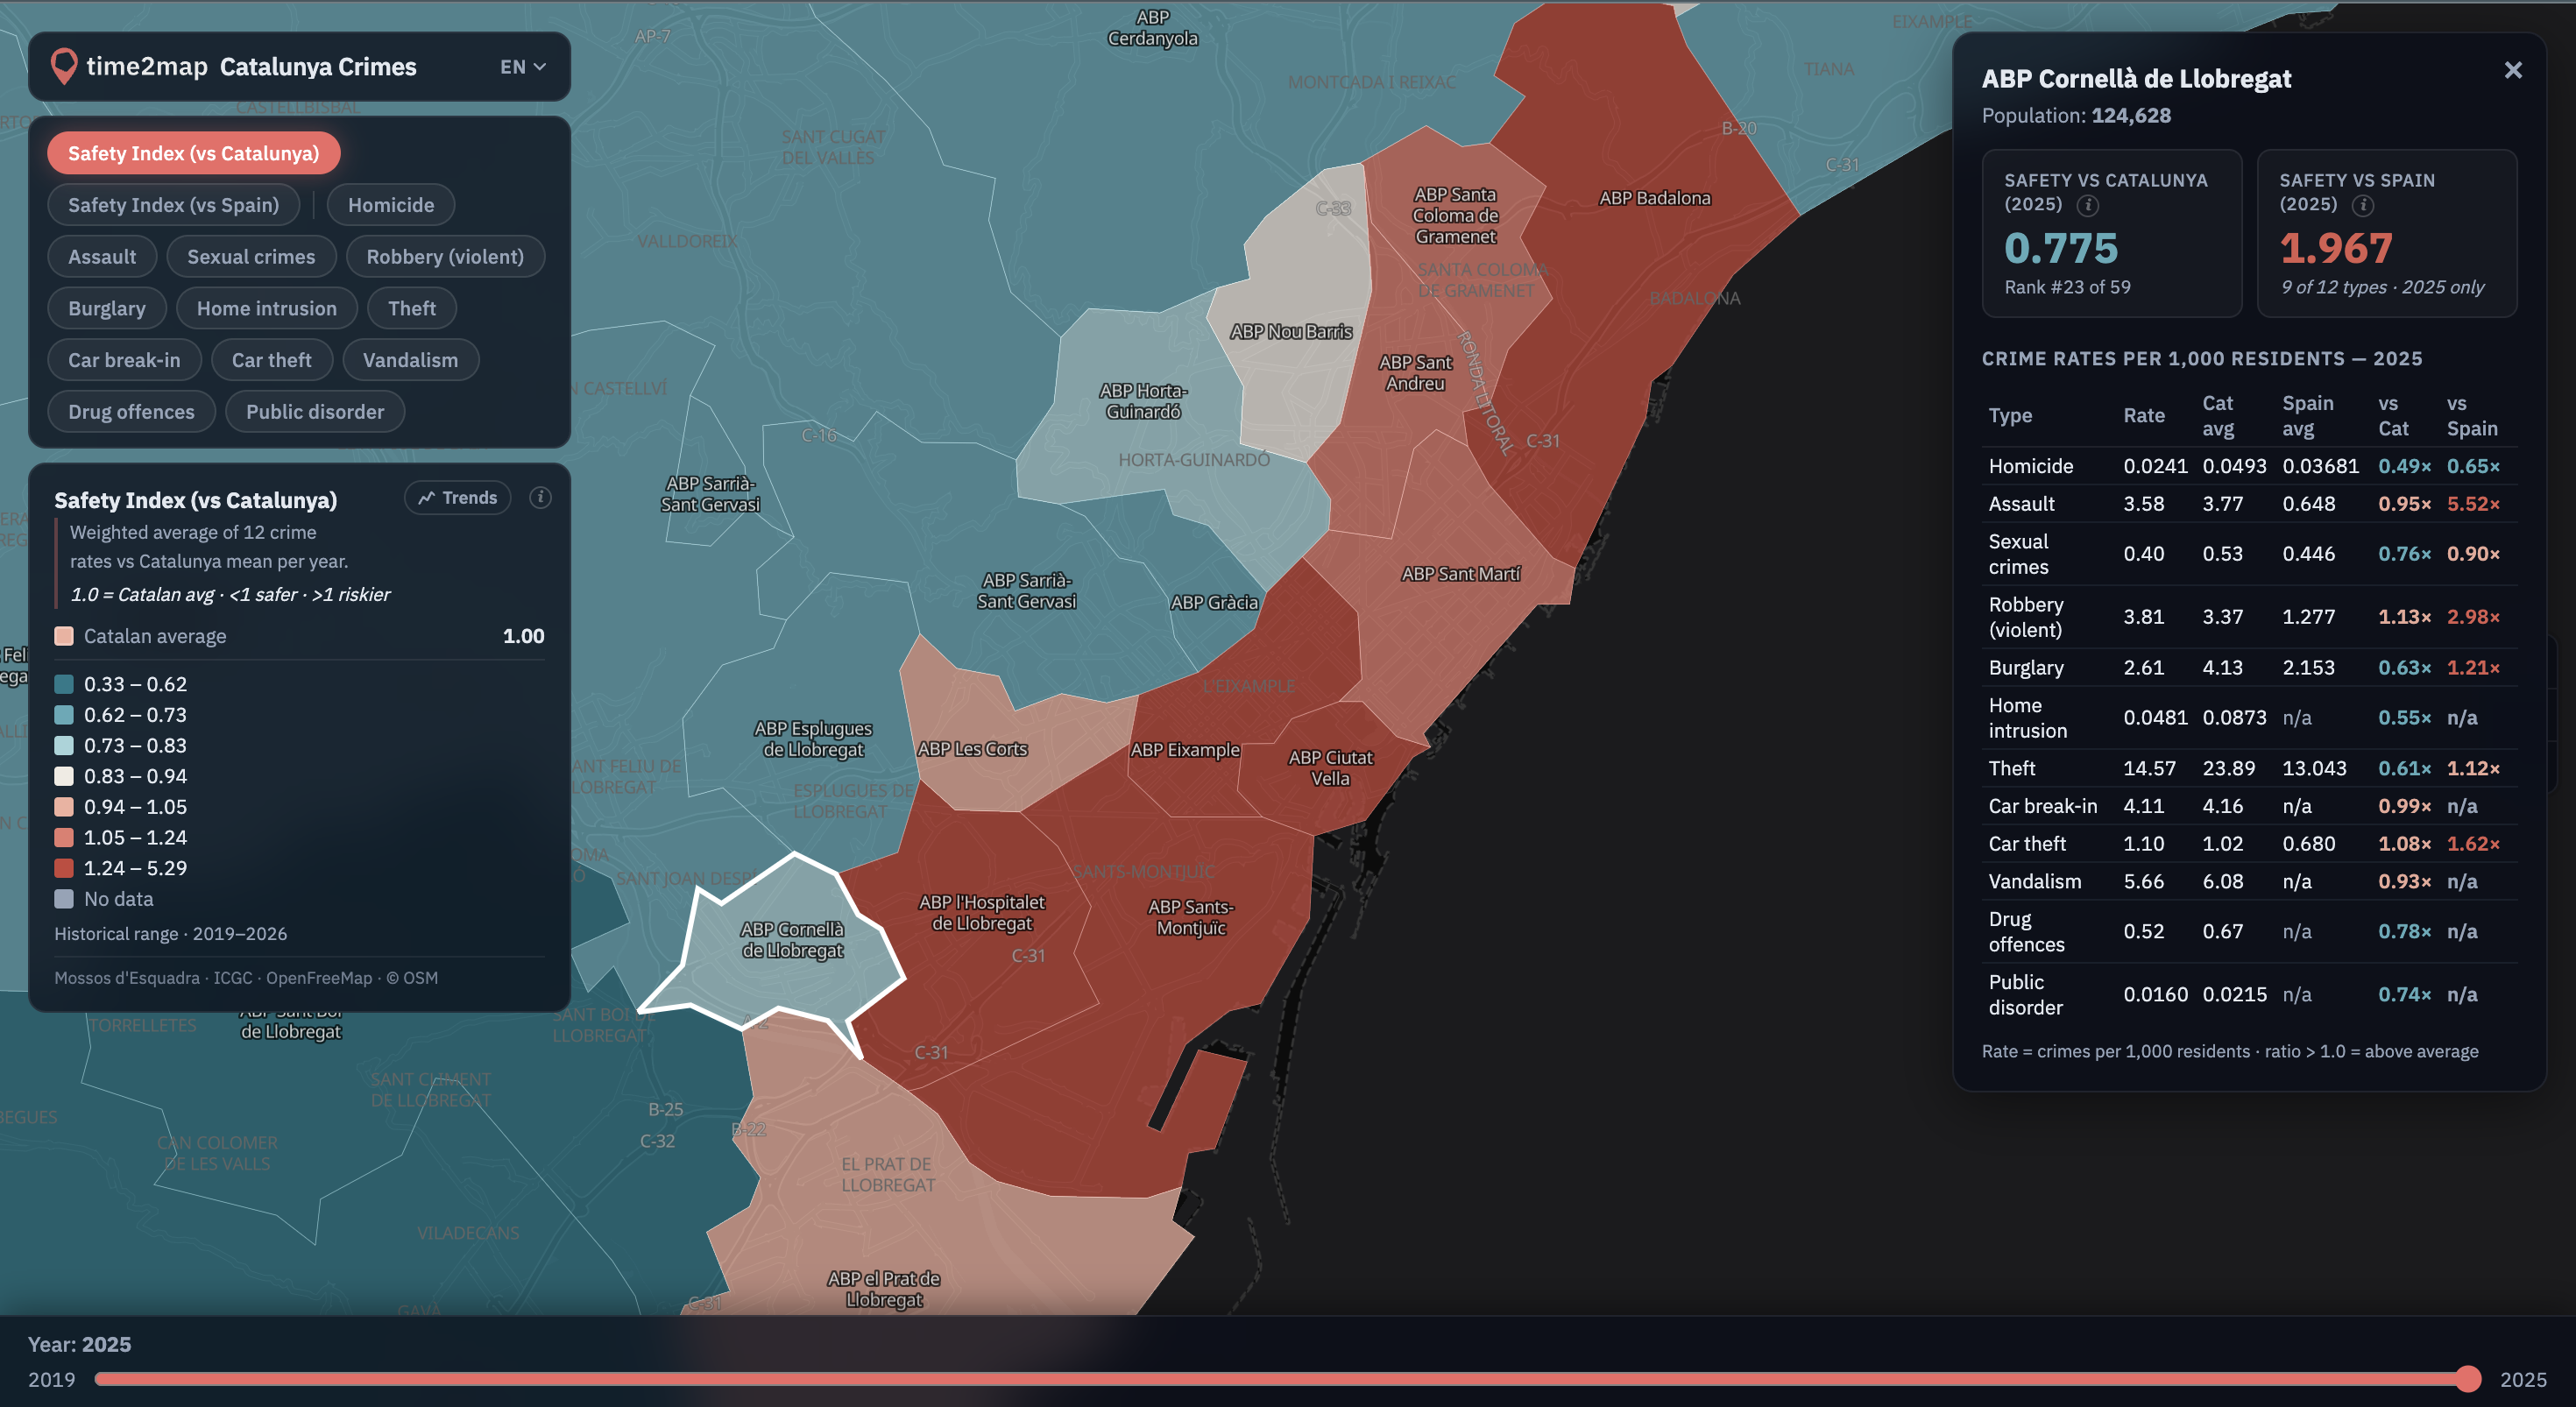
Safety index vs. Catalonia: 0.775, rank 23 of 59 among Catalunya. Cornellà consistently comes out among the safest neighborhoods in the Barcelona metropolitan area — a fact that rarely gets attention because it's not a central district. I discovered this in the data around the same time I was looking at the area personally. The subjective feeling matches the numbers.
Safety index vs. Catalonia: 1.672, rank 57 of 59 among Catalunya. That puts Sants-Montjuïc near the bottom of the Barcelona crime statistics by district ranking — yet Sants, where I live and know well, feels safe day-to-day. The likely explanation: the ABP zone is geographically large and includes Montjuïc hill, the port area, and industrial zones that pull the average up significantly.
The Alt Empordà – Roses zone, a coastal tourist area on the northern Costa Brava, recorded the highest home intrusion rate in all of Catalunya in 2025 — 0.087 per 1,000 residents, x10 of Catalan average. Seasonal vacancy during off-peak months is likely a driver: empty holiday homes are a well-documented target. The number stands out even compared to dense urban zones.

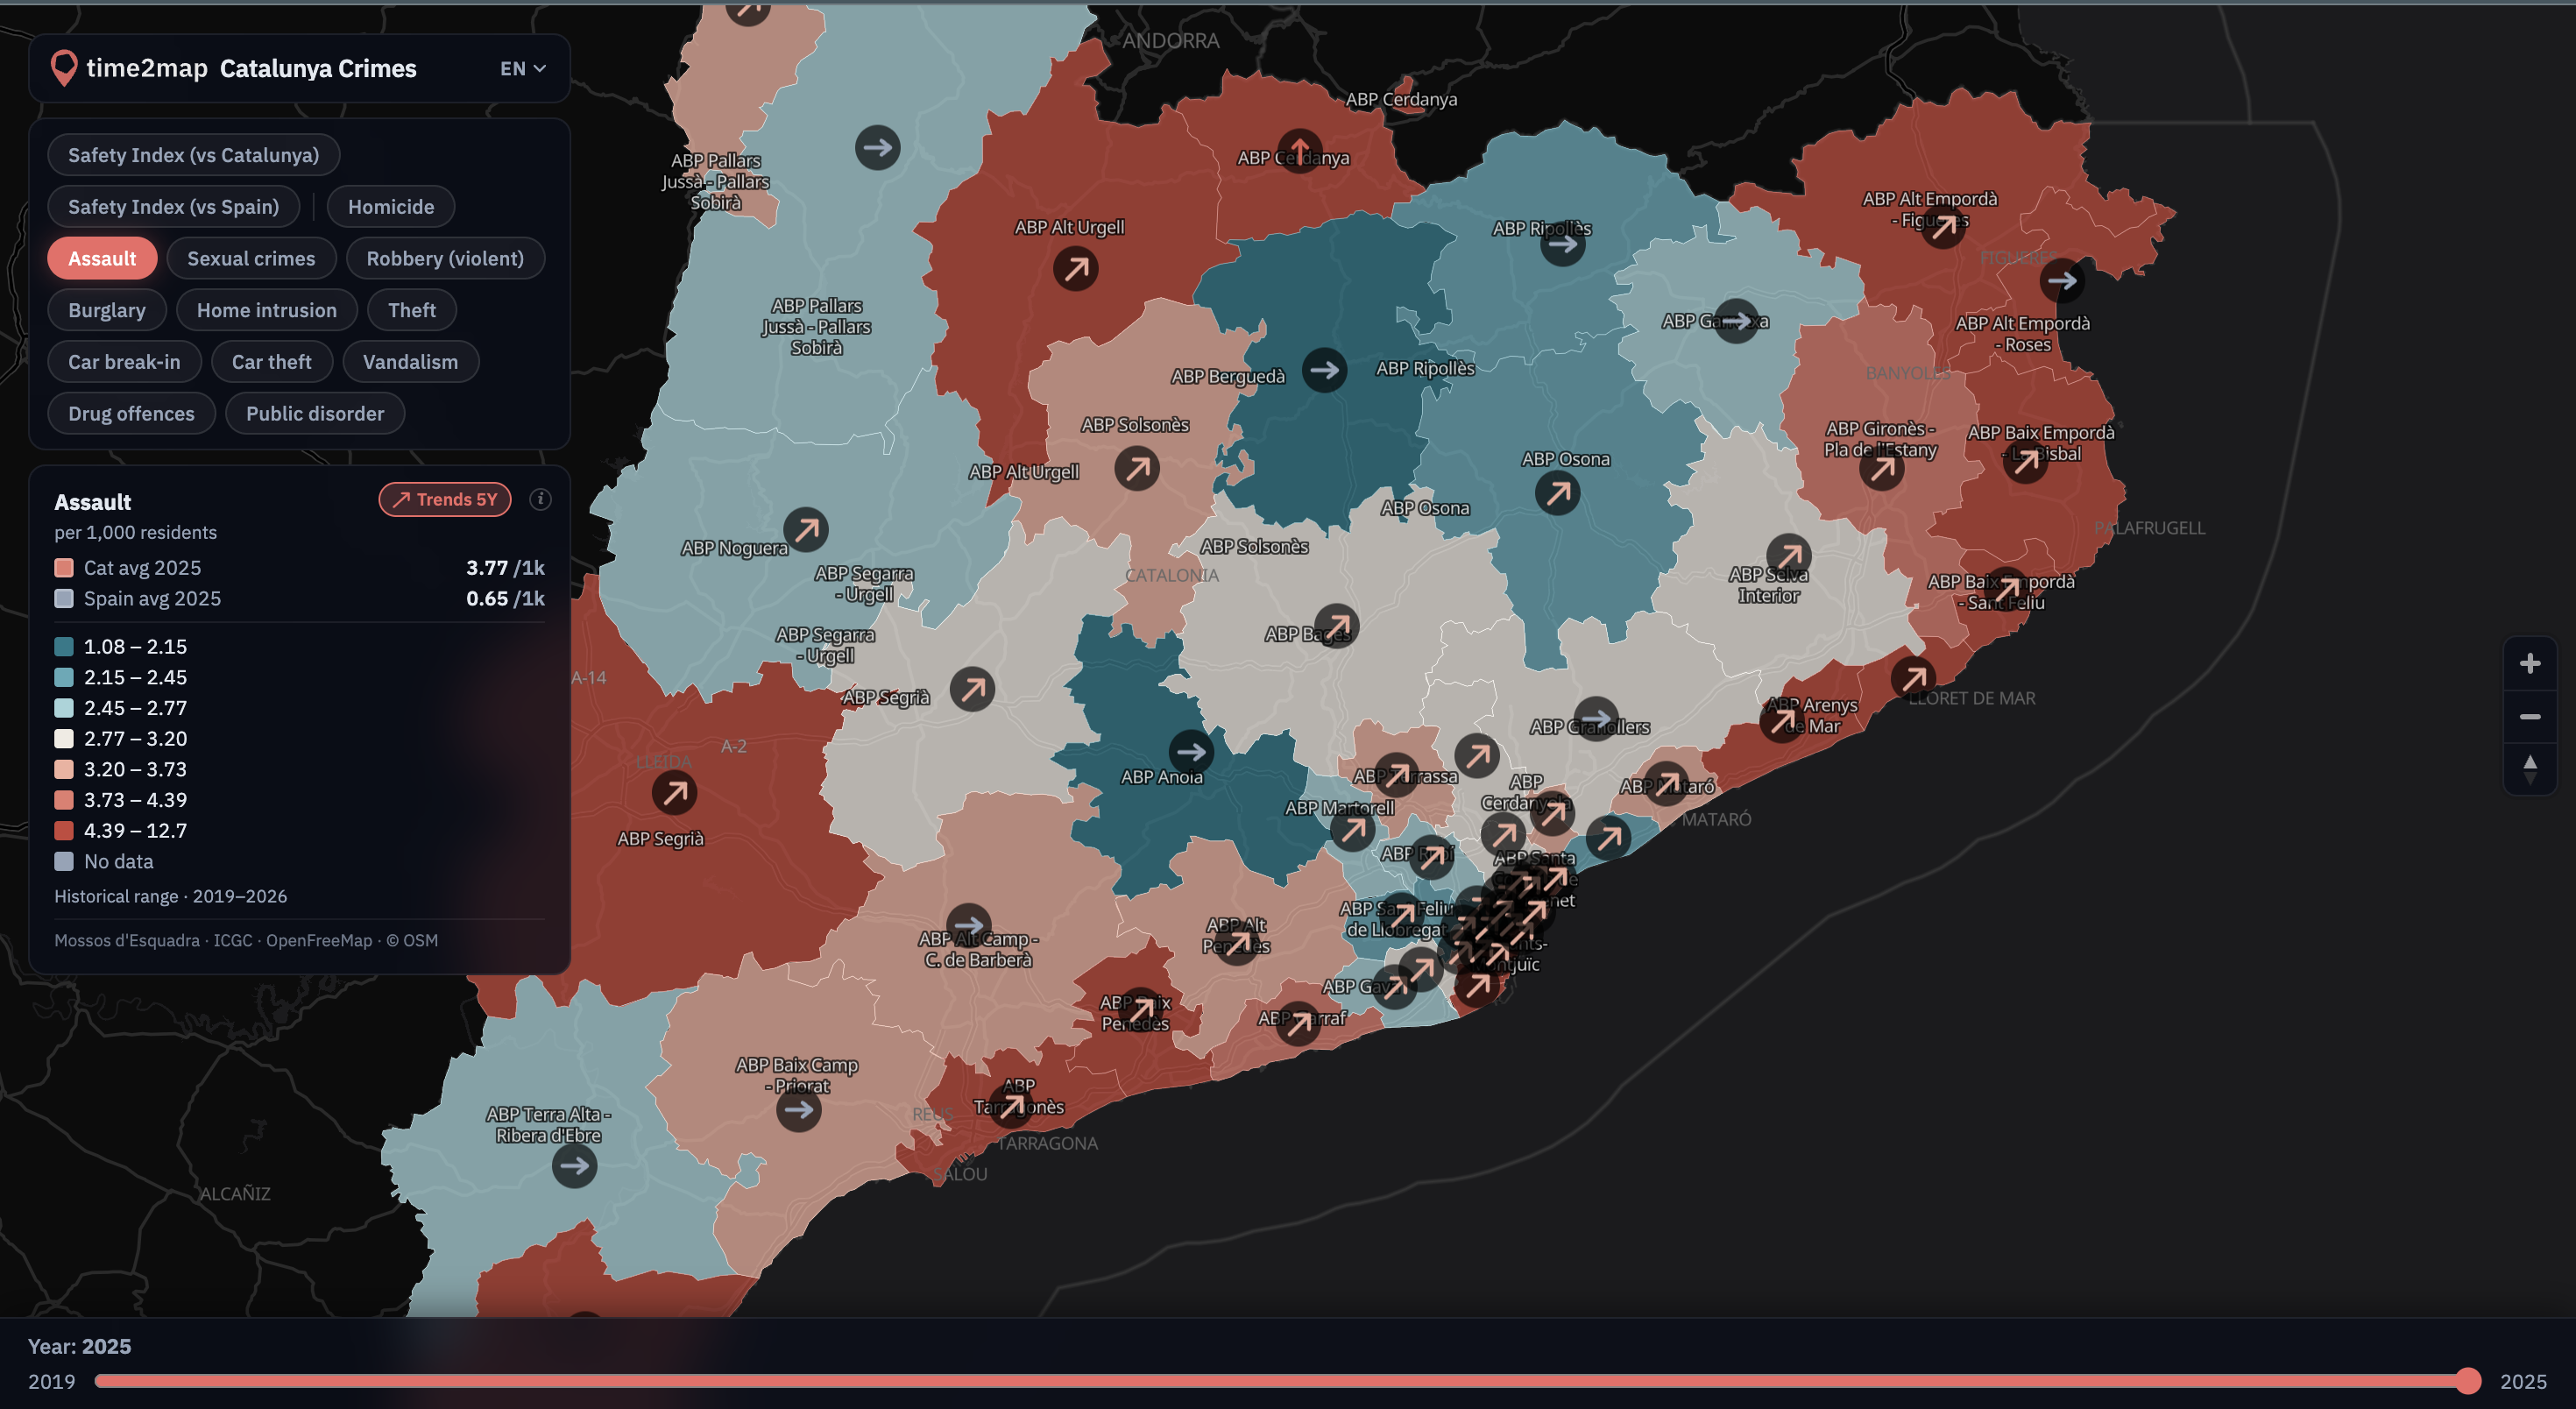
Across all 59 ABP zones, the 2019–2025 trend for home intrusion is flat or rising. Not a single zone shows a sustained downward trend over the full period. The sparkline arrows on the map confirm it region-wide — this isn't isolated spikes in a few areas but a consistent pattern across both urban and rural zones.

The trend map shows upward arrows across virtually every zone. The map show this is not a city-specific phenomenon: rural and coastal zones are affected equally.
Despite Barcelona's reputation for pickpocketing, theft rates have been falling across most central zones over the last two years (2023–2025). The trend arrows across central Barcelona consistently point downward — a notable counterpoint to the rising assault numbers. From the other side the indexes across Barcelona are still very high.

A note on limitations. Crime weights in the safety index are subjective — they reflect my priorities for outdoor safety. You can fork the repo and adjust them. The Spain comparison covers 9 of 12 crime types (2025 data only) — home intrusion, disorder, and drug offences are excluded due to differences in national reporting methodology. ABP zones are large geographic areas; a high-crime zone can contain safe and unsafe pockets that the data can't distinguish.
Geospatial developer based in Barcelona. I build maps and data tools — sometimes for clients, sometimes because the data is interesting. This one started as a personal project when I moved to the city and wanted to understand my neighbourhood better than the official tools allowed.


Maps and GIS solutions, built by specialists.
Barcelona, Spain
VAT: ES Z2405174T